Navigating the Brain's Blueprint: A Guide to Using the Human Connectome Project
Written by Mo
The Human Connectome Project (HCP) is like a treasure map for understanding the inner workings of our brains. It provides a detailed roadmap of the brain's structural and functional connections, shedding light on the complex web that orchestrates our thoughts, emotions, and actions. In this blog post, we'll explore how to use the HCP to delve into this fascinating realm of neuroscience. Get ready to embark on a journey through the neural pathways of the mind!
Step 1: Accessing the HCP Data
The first step on our journey is to access the rich dataset provided by the HCP. Follow these steps:
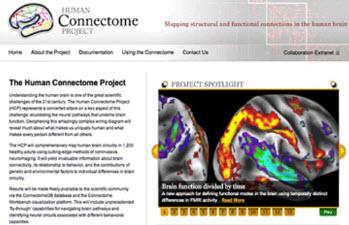
Visit the HCP Website: Start by going to the Human Connectome Project website.
Register for Access: To access the data, you'll need to create an account and agree to the terms of use. This ensures responsible and ethical use of the data.
Step 2: Understanding the HCP Data
Before diving into the data, it's essential to understand what you'll find. The HCP offers two main types of connectome data: structural and functional.
Structural Connectome: This data represents the physical wiring of the brain, akin to mapping the roads and highways of a city. It's obtained using Diffusion MRI (dMRI) technology.
Structural Connectome
Functional Connectome: Think of this as tracking the flow of traffic in the city. Functional connectome data comes from Resting-State Functional MRI (rs-fMRI) scans and task-based functional imaging.
Functional Connectome
Step 3: Navigating the Connectome Data
Now, let's explore how to navigate and visualize the connectome data:
Connectome Workbench: The HCP provides a powerful tool called the Connectome Workbench. Download and install it on your computer.
Connectome Workbench
Loading Data: Use the Connectome Workbench to load your desired connectome dataset, whether structural or functional.
Loading Data
Step 4: Exploring the Connectome
With the data loaded, you're ready to start exploring the connectome:
Visualizing Networks: You can visualize brain networks and connections in 3D using the Connectome Workbench. This helps you understand how different brain regions communicate.
Visualizing Networks
Analyzing Connectivity: Dive into the data to analyze connectivity patterns. Look for connections that might be associated with specific brain functions or disorders.
Analyzing Connectivity
Step 5: Applying the Knowledge
The insights gained from the HCP data can be applied in various fields, from neuroscience research to medical diagnostics and treatment. Researchers can use this data to study brain disorders, understand individual variability, and explore brain-behavior relationships.
Happy exploring!